Graphical Feedback: Difference between revisions
From Ameise-en
Jump to navigationJump to search
No edit summary |
No edit summary |
||
| Line 4: | Line 4: | ||
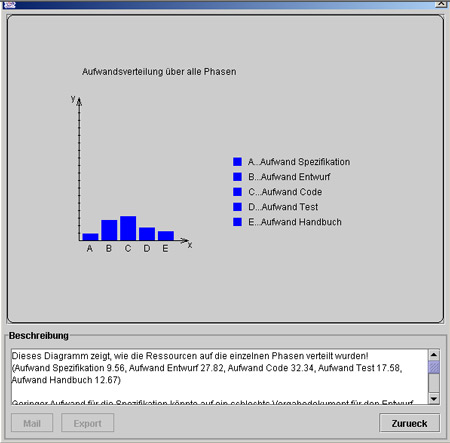
[[Image:auswertung_grafik.jpg|center|frame|The target «allocation of expenses over all phases» as an evaluation criterion]] | [[Image:auswertung_grafik.jpg|center|frame|The target «allocation of expenses over all phases» as an evaluation criterion]] | ||
[[de: | [[de:Auswertungen in grafischer Form]] | ||
[[en:Graphical Feedback]] | [[en:Graphical Feedback]] | ||
[[Category:Tutorial]] | [[Category:Tutorial]] | ||
__NOTOC__ | __NOTOC__ | ||
__NOEDITSECTION__ | __NOEDITSECTION__ | ||
Revision as of 19:31, 3 May 2013
Apart from the purely textual feedback, there are also graphical-textual presentations of evaluation resluts as it is shown in the following figure by using the «the allocation of expenses over all phases». In addition to each diagram, an explanatory text is displayed, where exact values of each bar in the chart are described together with possible aspects indicated by the chart.
